Add InstantSearch and Autocomplete to your search experience in just 5 minutes
A good starting point for building a comprehensive search experience is a straightforward app template. When crafting your application’s ...
Senior Product Manager
A good starting point for building a comprehensive search experience is a straightforward app template. When crafting your application’s ...
Senior Product Manager
The inviting ecommerce website template that balances bright colors with plenty of white space. The stylized fonts for the headers ...
Search and Discovery writer

Imagine an online shopping experience designed to reflect your unique consumer needs and preferences — a digital world shaped completely around ...
Senior Digital Marketing Manager, SEO

Winter is here for those in the northern hemisphere, with thoughts drifting toward cozy blankets and mulled wine. But before ...
Sr. Developer Relations Engineer

What if there were a way to persuade shoppers who find your ecommerce site, ultimately making it to a product ...
Senior Digital Marketing Manager, SEO

This year a bunch of our engineers from our Sydney office attended GopherCon AU at University of Technology, Sydney, in ...
David Howden &
James Kozianski

Second only to personalization, conversational commerce has been a hot topic of conversation (pun intended) amongst retailers for the better ...
Principal, Klein4Retail

Algolia’s Recommend complements site search and discovery. As customers browse or search your site, dynamic recommendations encourage customers to ...
Frontend Engineer

Winter is coming, along with a bunch of houseguests. You want to replace your battered old sofa — after all, the ...
Search and Discovery writer

Search is a very complex problem Search is a complex problem that is hard to customize to a particular use ...
Co-founder & former CTO at Algolia

2%. That’s the average conversion rate for an online store. Unless you’re performing at Amazon’s promoted products ...
Senior Digital Marketing Manager, SEO

What’s a vector database? And how different is it than a regular-old traditional relational database? If you’re ...
Search and Discovery writer

How do you measure the success of a new feature? How do you test the impact? There are different ways ...
Senior Software Engineer

Algolia's advanced search capabilities pair seamlessly with iOS or Android Apps when using FlutterFlow. App development and search design ...
Sr. Developer Relations Engineer

In the midst of the Black Friday shopping frenzy, Algolia soared to new heights, setting new records and delivering an ...
Chief Executive Officer and Board Member at Algolia

When was your last online shopping trip, and how did it go? For consumers, it’s becoming arguably tougher to ...
Senior Digital Marketing Manager, SEO

Have you put your blood, sweat, and tears into perfecting your online store, only to see your conversion rates stuck ...
Senior Digital Marketing Manager, SEO

“Hello, how can I help you today?” This has to be the most tired, but nevertheless tried-and-true ...
Search and Discovery writer
The Cloud Native Foundation is known for being the organization behind Kubernetes and many other Cloud Native tools. To foster the community around the CNCF they also organize local meetups all around the globe to talk about all things cloud-related.
On October 10th, we had the pleasure of receiving one of those meetups in our Paris office. As the host, we had the privilege of presenting one talk (about our efforts in reducing our observability bill), and should have had a second talk about green IT in the cloud.
This specific meetup was part of an initiative by a CNCF interest group called TAG environmental sustainability held during the month of October focused on the topic of environmental sustainability in the Cloud. They called that the CNCF Cloud Native Sustainability week, and this meetup was part of it.
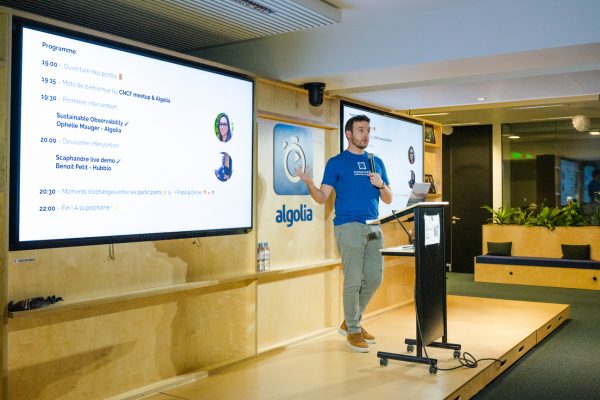
Unfortunately, our second speaker got sick and had to cancel on the morning of the event. We managed to find someone to replace him, and could have two talks as expected.
Jean-Brice, we hope you’re feeling better and hope to see you at the next iteration of the meetup. And Benoit, we can’t thank you enough for agreeing to cover for our missing speaker at a four-hour notice \o/.
The whole meetup was in French, so we decided to write a short recap of the talks to share here with a broader audience. You can still watch the full video if you’d like a little taste of the French tech scene 🥖
Andrea Giardini, meetup organizer and CNCF ambassador kicked off the meetup to discuss the upcoming KubeCon EU. The 2024 edition will take place in Paris next March, and that made Andrea worried about its ecological impact, especially with people flying from all over Europe to attend. By now KubeCon has become the largest open-source conference in Europe and this means thousands of people traveling to Paris next spring.
So in response, Andrea kickstarted the KubeTrain initiative. They will rent a whole train wagon in each European major city, heading to Paris, and KubeCon participants can board it.
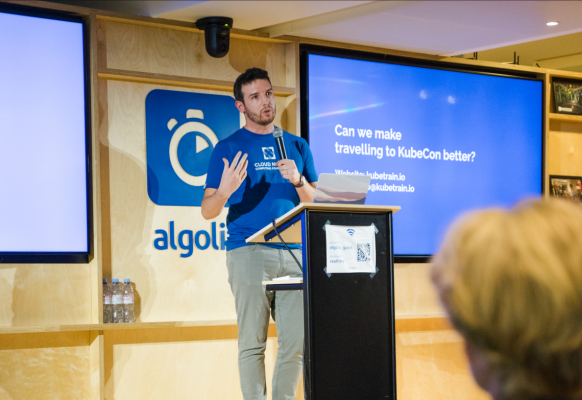
Sharing one train will greatly reduce the ecological impact, compared to flying. But it will also be cheaper for participants as they would have a discounted price for traveling to KubeCon. As an added benefit, traveling in a train full of KubeCon participants also opens up the possibility of organizing an in-train hackathon, having lightning talks, and more generally starting the conference in a fun atmosphere.
If you are interested in participating, organizing or sponsoring, you can reach out to the team on their website kubetrain.io or joining the #kubetrain Slack channel on slack.cncf.io.
The first real talk of the evening was delivered by Ophélie Mauger, part of the Algolia Production Engineering team (that is everything related to Kube, CI/CD and observability). You can find her slides here.
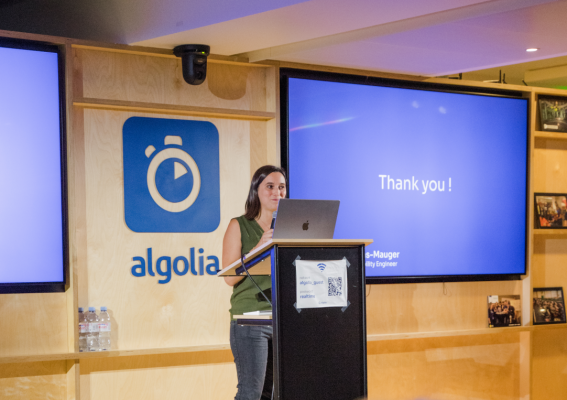
Adding AI capabilities to the Algolia engine required a large refactoring of our architecture, moving from a monolith running on bare metal servers, to microservices in the cloud. Our observability needs have grown exponentially with this change of architecture.

On our previous monolith, we only had to monitor the host, the app and the http layer. With microservices in Kubernetes, we also need to monitor the additional layers of containerd, `kubelet`, the orchestrator logs and metrics. We need APM traces to know exactly what part of a multi-service request holds a performance bottleneck.
Our estimate was that, given our current growing rate, we would have a projected cost of $1.5M in observability costs alone in one year. This was too much, so we set ourselves into reducing it before it grew too much.
We started working on the APM cost as it took 60% of our bill. Any improvement there could have a big impact. We quickly realized that we had very different needs of the APM traces in dev and in production.
In dev, we quickly realized that we absolutely needed every single trace. APM traces are our way of detecting performance regression; if we can’t measure performance, we can’t improve it. It was paramount to us to keep those traces available to our development team, so they could see the impact of their changes on the overall system performance.
In production though, we realized that we don’t actually need any trace because everything should be running perfectly, with never any issue, right? We all know that’s not true, and issues will happen in production, no matter what, and we need to be able to troubleshoot them. So we decided to remove all traces in production… unless we need them.
It means we still have the apps send their traces, but we have a filter in place at the agent level that, by default, filters them all out. It receives everything internally, but doesn’t send anything to Datadog. That filter can be toggled by our on-call engineers when there is a production issue, to temporarily let traces flows in.
This drastic change (not sending anything in prod) cut our bill by 93%, reducing a $30k/month bill to a more acceptable $2k/month bill.
But, astute reader, you might notice that this change will add some delay to our incident response time, as it requires manual intervention by someone to disable the filter, after the issue has been identified. And you would be totally right.
This is why we’re putting in place a smarter agent. One that would watch the current error rate and incoming traffic from Datadog, and if it detects any unusual spike, would toggle the filter off automatically, pre-emptively.

That way, if there is actually an incident, we already have the APM traces in advance, and can start investigating right away. But most of the time, nothing is sent, because we don’t need it.
Next, we had a look at our metrics. The cost of metrics was only 10% of the total cost, but we knew that this cost will only grow over time as it’s tightly tied to the number of customers and usage of the features.
We’re using Datadog, and Datadog charges based on the cardinality (number of different values) of the tags. We defined guidelines with the dev teams about what would be an “acceptable cardinality”.
We came up with three buckets. A blocklist of tags we’ll always reject. An allowlist of tags we’ll always accept. And the most dreaded bucket of “it depends” tags.
In the blocklist, we put the `pod_id`, because its cardinality is almost infinite and has no practical use.
The allow list contains any tags with a cardinality lower than 10. We also had some special tags, like `customer_id`, that were also always accepted. Even if their cardinality was huge, we knew we needed a way to filter metrics by customers, so we decided to always accept it.
The more nuanced “it depends” bucket is for tags that have an acceptable cardinality today, but will grow linearly over time. This includes anything related to the number of requests, servers, hosts, etc. Those tags need to be discussed on a case-by-case basis with the devs.
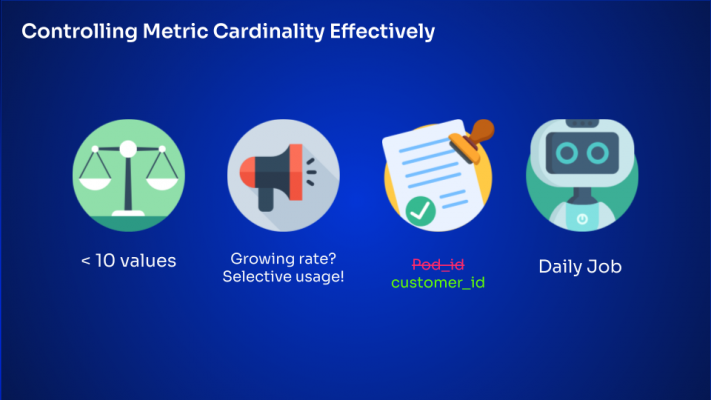
All those choices and the rationale behind it are documented, and knowledge has been shared across the teams. But we also automated it. We have another agent that checks our Datadog configuration regularly to see if the actual tags sent matches the guideline we define. We compare the tags we really use inside dashboards and alerts to keep only the active tags and remove the others on each metric.
Those small optimizations reduced the average of metrics cardinality by 73%, reducing our monthly bill from $10k to $1.5k.
Ophélie concluded that all those optimizations reduced our estimated cost from $1.5M to $400k \o/

The second talk was by Benoit Petit (and Benoit, once again we heavily thank you for accepting to present something within a 4 hours notice). Benoit is the maintainer of Scaphandre, an open source tool to gather electrical consumption of the server it’s installed on.

Scaphandre is an incredible tool to see how one can reduce its energy consumption by identifying the worst offenders in a fleet. It can send its data to Prometheus and allow filtering by process command line (so you can see which one of your services consumes more, for example).
That’s for the theory; the reality is harsher. Those metrics are usually surfaced by the underlying CPU (depending on its manufacturing date, those metrics could represent a more or less complete evaluation of all components energy consumption), but when running in a cloud environment, such data is rarely surfaced all the way back to the end user. This is why he called it Scaphandre (which means diving suit in french), because you need to go really deep in the internals to gather the metrics and bring them back.
Benoit explains how the various physical parts of a server (from the motherboard to the CPU and GPU) export metrics about their consumption. It was filled with acronyms that I would probably butcher if I were to transcribe them here, so I would recommend you have a look at the presentation instead.
Benoit contributes to a wider ecologically-conscious group working on a collaborative-science project called Energizta, that you can run on your dev and production machines. It gathers metrics about your consumption and hardware. On dev machines it does a stress test, while on prod machines it passively and silently pulls data from what is currently running.
The idea of Energizta is that hosting or cloud providers install the tooling on their bare metal machines, to share accurate information about their actual consumption and the activity of the different components. They then built a public database (accessible through an API), to make calculation easy by comparing the data they got with similar machines hosted by other companies.

Benoit concluded in saying that, even if the technical aspect of the project is interesting, it’s not the hardest part. The hardest part is making sense of the data to then be able to build better models and evaluation tools that may be useful on the public cloud. Being able to compare consumption of various cloud providers is hard, as most actors aren’t really transparent. One also has to take into account the cost when the physical server is actually built. Energy consumed by ICT is only a part (and actually only a proxy measurement) of the actual environmental impacts. Reducing it is far from being enough to actually reduce the pressure ICT has on climate and mining resources, for instance.
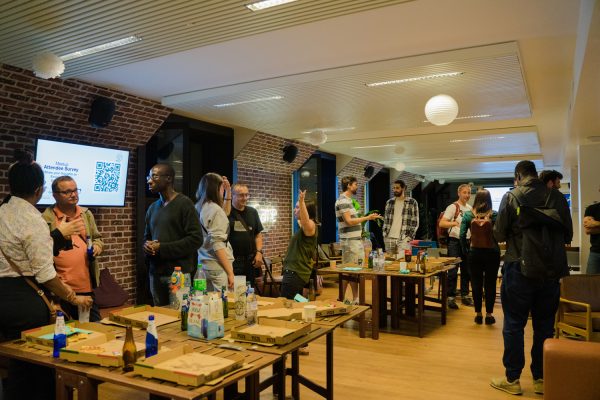
This CNCF meetup was everything I like about meetups. Talented and passionate people sharing their knowledge with their peers, to make us all better developers. We had many interesting discussions afterward, around food and drinks, and we can’t wait to host more meetups.
If you’re a meetup organizer and have an Algolia office in your city, don’t hesitate to get in touch with us, we’d be happy to help you.
Powered by Algolia Recommend